Our position
- Keep great public schools open. Schools anchor communities. Families need stability to plan years ahead. Closure threats weaken trust and push families away.
- Closures won’t fix the budget. Other districts have lost students and funding to large-scale closures. Promised efficiencies haven’t fixed their budgets.
- Make public schools work for everyone. Maintain academic excellence and support every learner. Keep families from every socioeconomic background invested.
A school worth knowing
Catharine Blaine
K–8.
Learning and community, side by side.
Catharine Blaine was planned alongside Magnolia’s community center, bringing education and recreation together. Its K–8 tradition lets children grow within one school community, rooted in the neighborhood around them. [1]
Get to know this school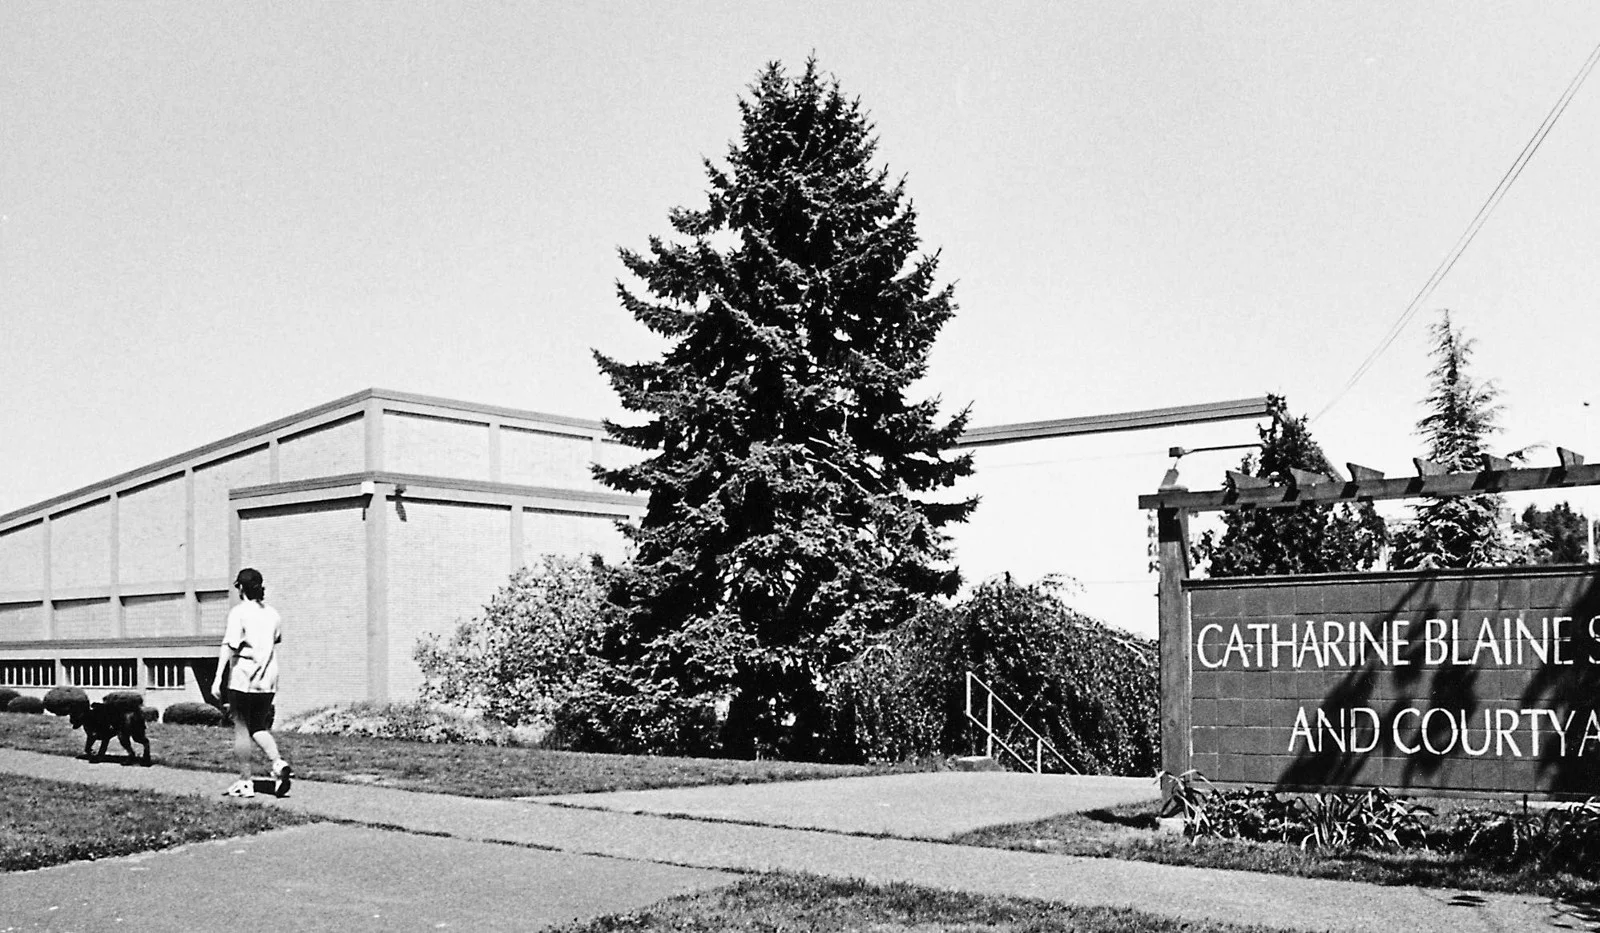 Magnolia, Seattle
01Community consent
Don’t close Catharine Blaine without community consent.
SPS included Catharine Blaine in both September 2024 closure alternatives. It was not among the final four schools recommended that October. The board withdrew that proposal in November 2024. [4][5][6]
The leadership has changed since then. The 2025 election brought Kathleen Smith and Jen LaVallee onto the board, alongside returning directors Vivian Song and Joe Mizrahi. [27] Brent Jones resigned in 2025. After Fred Podesta served as interim superintendent, Ben Shuldiner took over in February 2026. [28][29]
Plan for more students, not fewer schools. Rebuild trust, maintain academic excellence and help families discover what their local school offers. Give this community the stability and support to grow enrollment—and a direct say in its future.
The years after the proposals
- 442October 2024
- 449October 2025
- 488September 2026
SPS student headcounts [2]
02Nearby schools
Longer commutes. More crossings.
Closing a neighborhood school can mean longer school runs, time away from work and more busy streets for children to cross. Apparent savings to SPS are paid for in families’ time. Moving costs off the district’s books does not make them disappear.
Compare the 3 nearest SPS elementary or K–8 campuses to Catharine Blaine K-8, ranked by driving distance. [3][18]
Four schools. Four neighborhood communities.
Walking routes from Catharine Blaine K-8 and available neighborhood attendance areas.
© SPS 2025–26 GIS [20] · 2026–27 attendance map [21] · © SDOT / King County [22] · © OpenStreetMap contributors · Route data (ODbL)
Travel time for families.
Campus to campus · Driving: round trip per drop-off or pickup · Walking & distances: one way
| School | Parent driving Round trip | Child walking One way | Arterial crossings On foot |
|---|---|---|---|
6 min0.7 mi | 13 min0.5 mi | 2 mapped crossings: 28TH AVE W · 32ND AVE W | |
20 min1.6 mi | 31 min1.5 mi | 3 mapped crossings: 30TH AVE W · 32ND AVE W · W BARRETT ST | |
24 min2.6 mi | 60 min2.6 mi | 9 mapped crossings: 10TH AVE W · 15TH AV W NB OFF RP · 15TH AV W SB ON RP · 20TH AVE W · 22ND AVE W · 28TH AVE W · 32ND AVE W · 7TH AVE W · W DRAVUS ST |
Driving: 2× one-way estimate, without traffic · Google Maps · Walking routes [18][19]
03Enrollment
More kids in Seattle. Fewer in public schools.
Enrollment & the city
2010–2024 · Each line uses its own color-matched scale.
- Catharine Blaine students4382024
Left scale
- Seattle children under 18109,5192024
Right scale
- Private K–12 share25.8%2024
Right scale
Dashed segments interpolate the 2020 gap. Sources: NCES and Census ACS. [3][16][17]
Seattle’s under-18 population grew from about 100,000 in 2022 to 110,000 in 2024. Private schools’ share of K–12 enrollment rose from 21.8% in 2019 to 25.8% in 2024. [16][17]
Uncertainty weakens public schools.
Continued closure uncertainty gives families who can afford private school another reason to leave. With them go students, funding and advocates. Instead of protecting a safety net, we erode the public support that sustains it. Public schools need families from every socioeconomic background invested in their success.
1986–2024: the longer enrollment record
| Fall | Students | Teacher FTE |
|---|---|---|
| 1986 | 450 | 25 |
| 1987 | 565 | 28 |
| 1988 | 637 | 27 |
| 1989 | 429 | 22 |
| 1990 | 465 | 19 |
| 1991 | 422 | 21 |
| 1992 | 368 | 18 |
| 1993 | 339 | 17 |
| 1994 | 343 | 17 |
| 1995 | 397 | 19 |
| 1996 | 397 | 18 |
| 1997 | 471 | 18 |
| 1998 | 546 | 23 |
| 1999 | 521 | 23 |
| 2000 | 508 | 23 |
| 2001 | 490 | 24 |
| 2002 | 493 | 24 |
| 2003 | 512 | 26 |
| 2004 | 498 | 26 |
| 2005 | 506 | 25 |
| 2006 | 487 | 26 |
| 2007 | 499 | 24 |
| 2008 | 515 | 24 |
| 2009 | 542 | 28 |
| 2010 | 547 | 29 |
| 2011 | 583 | 27 |
| 2012 | 621 | 34 |
| 2013 | 635 | — |
| 2014 | 680 | 36 |
| 2015 | 738 | 34 |
| 2016 | 770 | 37 |
| 2017 | 782 | 39 |
| 2018 | 759 | 40 |
| 2019 | 629 | 33 |
| 2020 | 533 | 31 |
| 2021 | 466 | 26 |
| 2022 | 450 | 24 |
| 2023 | 436 | 24 |
| 2024 | 438 | 24 |
The series follows this school’s NCES identifier. Grade spans and programs have changed over time. [3]
Recent district enrollment counts
| Count date | All students | Funded students |
|---|---|---|
| October 2019 | 629 | 629 |
| October 2020 | 533 | 533 |
| October 2021 | 466 | 466 |
| October 2022 | 452 | 452 |
| October 2023 | 441 | 441 |
| October 2024 | 442 | 442 |
| October 2025 | 449 | 449 |
| September 2026 | 488 | 488 |
September and October counts are different snapshots. [2]
04Public investment
Invest here. Then walk away?
Keep these investments working for students and their neighborhoods.
$900K
Completed seismic project
2021 closeout [23]
- Gymnasium, auditorium and chimney seismic work$899,758
$1.1M
Capital allocated this year
2026–27 adopted budget [25]
- Electrical, phase II$300,450
- Site and security$231,770
- Ceiling fans$117,031
- Exterior doors, phase II$88,600
- Roof improvements$316,213
Annual allocations cover one fiscal year; they are separate from total project costs.
BEX VI · 2026–31
Technology for this school.
Student and staff devices, digital learning and cybersecurity. [13]
Projects, amounts & sources
Earlier projects and levy plans
- Gymnasium, auditorium and chimney seismic work$899,758
2021 closeout · BEX IV · Recorded spending [23]
- Seismic construction contract · included in total$689,930
2021 closeout · BEX IV · Paid construction contract [23]
- Ceiling fans$500,000
2018 levy estimate · BEX V · Original levy estimate [24]
- Playground$100,000
2018 levy estimate · BEX V · Original levy estimate [24]
- Electrical upgrades$5,973,139
2018 levy estimate · BEX V · Original levy estimate [24]
- Exterior doors$286,467
2018 levy estimate · BEX V · Original levy estimate [24]
Construction record
- Electrical upgrades, fans and exterior doors
Completed 2025 · BEX V [26]
Earlier SPS project listings [14]
- 2017: Install new fire sprinklers. Replace existing water mains.
- 2013: Upgraded roofing and made exterior building improvements including resealing windows and re-pointing masonry. Replaced old heating controls with programmable electronic controls and made associated improvements.
- 2011: Replaced roof on remaining areas of school. Replaced select clerestory windows. Installed energy-conserving fan and pump motors.
- 2011: Replaced boiler burners.
- 2009: Science classroom upgrades: new sinks, counter tops and cabinets, and new prep/storage room. Four new classrooms. New flooring installed in corridors, main office and lunchroom. Ceiling tiles replaced/repainted. Boiler updates. New water heater and toilet room exhaust fans.
- 2008: Re-roof and exterior restoration
- 2006: Waterline replacement
- 2005: Library Upgrade
- 1999: Reroofing, Elec/Data/Phone/Intercom
- 1999: Wide Area Network
6 years of reported actual spending
| School year | School-coded spending | Total with allocations | Student FTE | Reported per pupil |
|---|---|---|---|---|
| 2019-20 | — | $9,133,297 | 626.81 | $14,571 |
| 2020-21 | — | $8,112,707 | 521.90 | $15,545 |
| 2021-22 | — | $8,451,192 | 462.69 | $18,265 |
| 2022-23 | — | $8,881,329 | 453.31 | $19,592 |
| 2023-24 | $4,887,175 | $8,388,674 | 439.25 | $19,098 |
| 2024-25 | $5,463,984 | $9,190,979 | 439.89 | $20,894 |
15 years of budgets and funded staffing
| School year | Budget | Budgeted students | Staff FTE | Budget per student |
|---|---|---|---|---|
| 2010-11 | $3,315,023 | 536 | 38.9 | $6,185 |
| 2011-12 | $3,514,977 | 549 | 41.5 | $6,403 |
| 2012-13 | $3,859,572 | 594 | 45.8 | $6,498 |
| 2013-14 | $3,728,970 | 637 | 42.6 | $5,854 |
| 2014-15 | $3,864,469 | 657 | 42.9 | $5,882 |
| 2016-17 | $4,607,929 | 744 | 47.2 | $6,193 |
| 2017-18 | $5,433,550 | 806 | 50.7 | $6,741 |
| 2018-19 | $5,789,413 | 792 | 52.8 | $7,310 |
| 2019-20 | $4,931,596 | 613 | 41.1 | $8,045 |
| 2020-21 | $4,972,012 | 595 | 39.3 | $8,356 |
| 2021-22 | $4,331,030 | 491 | 33.0 | $8,821 |
| 2022-23 | $4,364,302 | 451 | 30.8 | $9,677 |
| 2023-24 | $4,463,932 | 417 | 31.9 | $10,705 |
| 2024-25 | $4,647,474 | 432 | 31.7 | $10,758 |
| 2025-26 | $4,860,531 | 432 | 32.8 | $11,251 |
Budget allocations are distinct from actual expenditure. 2025-26 budget: [9]
2010-11 source ↗2011-12 source ↗2012-13 source ↗2013-14 source ↗2014-15 source ↗2016-17 source ↗2017-18 source ↗2018-19 source ↗2019-20 source ↗2020-21 source ↗2021-22 source ↗2022-23 source ↗2023-24 source ↗2024-25 source ↗2025-26 source ↗
Teacher headcounts
| School year | Teachers | Students in this report |
|---|---|---|
| 2017-18 | 44 | 782 |
| 2018-19 | 48 | 759 |
| 2019-20 | 39 | 629 |
| 2020-21 | 40 | 533 |
| 2021-22 | 37 | 466 |
| 2022-23 | 34 | 454 |
| 2023-24 | 32 | 441 |
| 2024-25 | 28 | 442 |
05Learning
Student outcomes.
Academic excellence for every student builds families’ trust. Keep expectations high, give each learner the support to succeed and measure progress honestly. SPS should improve outcomes, not dilute the metrics used to judge them. That is how Seattle can become the nation’s No. 1 urban school district.
Share of tested students meeting the state standard, across tested grades. [10]
English language arts · 2025–26
Mathematics · 2025–26
Science · 2025–26
- English language arts
- Mathematics
- Science
Assessment results by school year
| School year | ELA | Math | Science |
|---|---|---|---|
| 2014-15 | 76.1% | 77.1% | 84.2% |
| 2015-16 | 84.2% | 81.9% | 85.5% |
| 2016-17 | 79.2% | 79.5% | 90.1% |
| 2017-18 | 80.1% | 80.8% | 80.5% |
| 2018-19 | 80.8% | 77.3% | 72.9% |
| 2021-22 | 81.8% | 72.2% | 73.0% |
| 2022-23 | 79.4% | 73.5% | 81.1% |
| 2023-24 | 79.7% | 79.7% | 84.8% |
| 2024-25 | 82.0% | 80.0% | 79.0% |
| 2025-26 | 85.7% | 80.6% | 87.5% |
Suppressed results stay blank in the chart. Science assessments changed during this period; the trend above covers the current testing era. [10][11][12]
06History & community
Rooted in Magnolia.
Catharine Blaine opened in 1952 through a joint school-and-parks project. It began as a junior high, later reopened as an elementary school, and added seventh and eighth grades in 1997–98. Its namesake was Seattle’s first schoolteacher and a signer of the Seneca Falls Declaration of Sentiments. [1]
- 1952
School opened alongside the community center.
- 1982
Junior high closed.
- 1984
Reopened as an elementary school.
- 1997–1998
Seventh and eighth grades added.
- 2009
Science rooms upgraded and four classrooms added.
- 2019
Seismic improvements.
The school history connects its enrollment decline after 2018–19 with Magnolia Elementary’s reopening and the pandemic. [1]
07Research
Sources & citations.
- 01
SPS / HistoryLink
Building for Learning: school and building history, 2022Origins, building chronology and community history.
- 02
Seattle Public Schools
Monthly P223 enrollment reportsOctober 2019–2025 and September 2026. Total headcount includes preschool where offered.
- 03
NCES / Urban Institute
Common Core of Data: annual school enrollmentA consistent school identifier; grade spans and program locations can change.
- 04
KUOW
September 11, 2024: the two closure alternativesOption A named 21 schools; Option B named 17. Their union contains 22 distinct schools.
- 05
Seattle Public Schools
October 24, 2024: preliminary recommendationsNorth Beach, Sacajawea, Sanislo and Stevens, with named receiving schools.
- 06
Seattle School Board
November 26, 2024: withdrawal recordBoard action on withdrawal of the preliminary school-closure recommendation.
- 07
Washington OSPI
Actual school-level expenditures, 2019–2025Report-card spending includes district allocations; denominator is annual-average student FTE.
- 08
Washington OSPI
F-196 expenditures by school location2023–24 and 2024–25 school-coded actuals. These may already include costs allocated by the district.
- 09
Seattle Public Schools
School budgets and funded staffingSchool allocations and planned staff FTE; separate from actual expenditures and employee headcounts.
- 10
Washington OSPI
State assessment results, 2021–2026All Students, All Grades, general assessments; percent meeting standard among tested students.
- 11
Washington OSPI
Historical state assessments, 2014–2017Different subjects/test regimes retained separately; suppressed results remain unpublished.
- 12
Washington OSPI
Historical state assessments, 2017–2019General assessments; results for tested students.
- 13
Seattle Public Schools
BEX VI: approved 2025 capital levy$1.8 billion districtwide, collected 2026–2031. School project lists are not school-specific expenditure totals.
- 14
Seattle Public Schools
School directory and levy projectsSchool address, programs and dated building projects.
- 15
Washington OSPI
Teacher counts and student–teacher ratiosClassroom teacher headcounts, 2017–18 through 2024–25; distinct from staff FTE.
- 16
U.S. Census Bureau
Seattle children: ACS B09001Seattle residents under 18, including preschool-age children; annual estimates through 2024.
- 17
U.S. Census Bureau
Seattle public and private enrollment: ACS B14002Private share of city residents enrolled in K–12. The 2020 chart gap is interpolated.
- 18
Valhalla / FOSSGIS / OpenStreetMap
Campus-to-campus route estimatesCached pedestrian and shortest-distance driving routes, October 2026. No live traffic in these source records.
- 19
Seattle Department of Transportation
Official arterial street classificationsPrincipal, minor and collector arterial street geometry.
- 20
Seattle Public Schools GIS
Elementary attendance areas, 2025–26Published geographic boundaries; option schools do not have ordinary attendance areas.
- 21
Seattle Public Schools
Current district attendance-area reference2026–27 district PDF map; a separate vintage from the available GIS.
- 22
- 23
Seattle Public Schools
Catharine Blaine seismic project: final acceptance2021 closeout: $899,758 completed project; $689,930 construction contract is included.
- 24
Seattle Public Schools
BEX V levy resolution and original project estimatesOct. 30, 2018 board action packet. Budget attachment is labeled preliminary; estimates precede escalation and later project changes. PDF pp. 18–19.
- 25
Seattle Public Schools
2026–27 adopted capital budgetAnnual project allocations, not lifetime costs or remaining balances. PDF pp. 185–187; printed pp. 178–180.
- 26
Seattle Public Schools
SPS recent completed construction projectsCompleted work and funding sources, including 2019–25 summer projects. Accessed Oct. 9, 2026.
- 27
Seattle Public Schools
New Directors Sworn in to Seattle School BoardDec. 8, 2025. Kathleen Smith and Jen LaVallee joined; Joe Mizrahi and Vivian Song continued after the November election.
- 28
Seattle Public Schools Archives
SPS directors and superintendents2025 revision, page 9. Brent Jones resigned in 2025; Fred Podesta served as interim superintendent.
- 29
Seattle Public Schools
New Superintendent Begins Tenure Leading Seattle Public SchoolsFeb. 2, 2026. Ben Shuldiner began leading the district.