Our position
- Keep great public schools open. Schools anchor communities. Families need stability to plan years ahead. Closure threats weaken trust and push families away.
- Closures won’t fix the budget. Other districts have lost students and funding to large-scale closures. Promised efficiencies haven’t fixed their budgets.
- Make public schools work for everyone. Maintain academic excellence and support every learner. Keep families from every socioeconomic background invested.
A school worth knowing
McGilvra
Elementary.
A small school. A strong community.
A Madison Park landmark where generations of children have learned since 1899. McGilvra combines a walkable neighborhood campus with an active PTA supporting art, enrichment and family connection. [1][41]
Get to know this school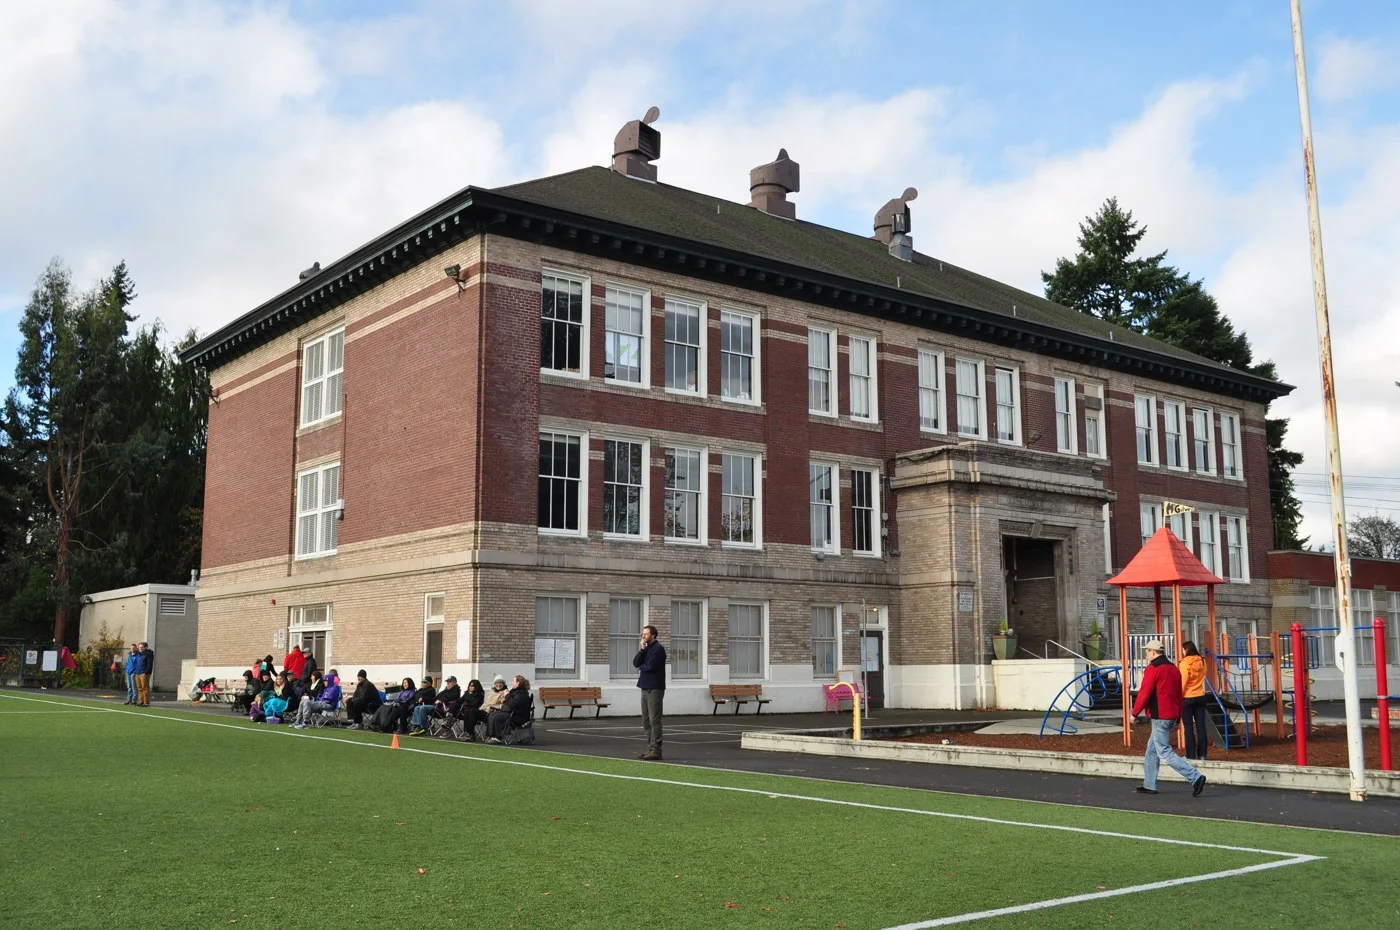 Madison Park, Seattle
01Community consent
Don’t close McGilvra without community consent.
SPS included McGilvra in both September 2024 closure alternatives. It was not among the final four schools recommended that October. The board withdrew that proposal in November 2024. [4][16]
The leadership has changed since then. The 2025 election brought Kathleen Smith and Jen LaVallee onto the board, alongside returning directors Vivian Song and Joe Mizrahi. [42] Brent Jones resigned in 2025. After Fred Podesta served as interim superintendent, Ben Shuldiner took over in February 2026. [43][44]
McGilvra is working with local community organizations on its own marketing and growth plan. Its PTA is promoting enrollment through school tours and parent outreach. [45] Build on that work: maintain academic excellence, welcome more families and give the school the stability to grow. McGilvra’s future should be shaped with its community’s consent.
The years after the proposals
- 193October 2024
- 187October 2025
- 187September 2026
SPS student headcounts [6]
02Nearby schools
Longer commutes. More crossings.
Closing a neighborhood school can mean longer school runs, time away from work and more busy streets for children to cross. Apparent savings to SPS are paid for in families’ time. Moving costs off the district’s books does not make them disappear.
Compare the 3 nearest SPS elementary or K–8 campuses to McGilvra Elementary, ranked by driving distance. [17][18]
Four schools. Four neighborhood communities.
Walking routes from McGilvra and available neighborhood attendance areas.
© SPS 2025–26 GIS [20] · 2026–27 attendance map [21] · © SDOT / King County [22] · © OpenStreetMap contributors · Route data (ODbL)
Travel time for families.
Campus to campus · Driving: round trip per drop-off or pickup · Walking & distances: one way
| School | Parent driving Round trip | Child walking One way | Arterial crossings On foot |
|---|---|---|---|
16 min2.0 mi | 41 min1.7 mi | 6 mapped crossings: E Madison St · Lake Washington Blvd E · E John St · 32nd Ave E · E Denny Way · E Union St | |
18 min2.1 mi | 41 min1.9 mi | 4 mapped crossings: Lake Washington Blvd E · Boyer Ave E · 24th Ave E | |
20 min2.1 mi | 46 min2.1 mi | 4 mapped crossings: Lake Washington Blvd E · E Madison St · 23rd Ave E · 19th Ave E |
Driving: 2× one-way estimate, without traffic · Google Maps · Walking routes [18][19]
03Enrollment
More kids in Seattle. Fewer in public schools.
Enrollment & the city
2010–2024 · Each line uses its own color-matched scale.
- McGilvra students1942024
Left scale
- Seattle children under 18109,5192024
Right scale
- Private K–12 share25.8%2024
Right scale
Dashed segments interpolate the 2020 gap. Sources: NCES and Census ACS. [5][23][24]
39 years. A changing school.
Annual student headcount · Fall 1986–2024
The recent enrollment picture.
October P223 counts, 2019–2025 · September 2026 shown separately
September 2026: 187 students. Separate monthly observation.
Data & sources
| Year | McGilvra students | Seattle under 18 | Private K–12 share |
|---|---|---|---|
| 2010 | 269 | 95,293 ± 5,001 | 19.4% ± 2.7 pp |
| 2011 | 299 | 98,585 ± 3,957 | 20.7% ± 2.2 pp |
| 2012 | 301 | 97,199 ± 4,372 | 22.1% ± 2.8 pp |
| 2013 | 288 | 100,535 ± 5,296 | 23.2% ± 2.6 pp |
| 2014 | 286 | 99,837 ± 4,811 | 19.9% ± 2.3 pp |
| 2015 | 275 | 99,795 ± 4,654 | 21.1% ± 2.7 pp |
| 2016 | 282 | 105,996 ± 5,142 | 21.2% ± 2.7 pp |
| 2017 | 242 | 114,411 ± 5,315 | 18.3% ± 2.5 pp |
| 2018 | 243 | 111,713 ± 5,986 | 21.7% ± 2.2 pp |
| 2019 | 239 | 110,672 ± 5,207 | 21.8% ± 2.4 pp |
| 2020 | 226 | 104,893 (interpolated) | 23.3% (interpolated) |
| 2021 | 223 | 99,114 ± 5,548 | 24.9% ± 3.5 pp |
| 2022 | 222 | 100,014 ± 5,563 | 17.3% ± 2.2 pp |
| 2023 | 215 | 109,297 ± 5,966 | 25.1% ± 2.6 pp |
| 2024 | 194 | 109,519 ± 6,349 | 25.8% ± 3.4 pp |
City estimates describe Seattle residents, not the McGilvra catchment. Under-18 population includes younger children. Private share is private K–12 enrollment divided by public plus private K–12 enrollment; it excludes preschool and college. [23][24]
McGilvra: NCES fall headcounts. City: Census ACS tables B09001 and B14002, surveyed throughout the calendar year. The city series ends in 2024, the latest release retrieved. [5][27]
The missing 2020 city values are linearly interpolated between 2019 and 2021. Survey margins apply only to reported estimates; the private-share margin is approximate. Margins remain in this table and point descriptions to keep the overlaid chart clear. [25][26]
School headcounts differ by source: 2024–25 is 194 in CCD/OSPI and 193 in SPS’s October P223. P223 is shown separately below. These records do not establish why individual families enrolled or left.
| Fall year | Students |
|---|---|
| 1986 | 215 |
| 1987 | 231 |
| 1988 | 256 |
| 1989 | 206 |
| 1990 | 195 |
| 1991 | 185 |
| 1992 | 213 |
| 1993 | 190 |
| 1994 | 177 |
| 1995 | 202 |
| 1996 | 212 |
| 1997 | 215 |
| 1998 | 226 |
| 1999 | 234 |
| 2000 | 236 |
| 2001 | 243 |
| 2002 | 240 |
| 2003 | 239 |
| 2004 | 241 |
| 2005 | 254 |
| 2006 | 257 |
| 2007 | 253 |
| 2008 | 250 |
| 2009 | 257 |
| 2010 | 269 |
| 2011 | 299 |
| 2012 | 301 |
| 2013 | 288 |
| 2014 | 286 |
| 2015 | 275 |
| 2016 | 282 |
| 2017 | 242 |
| 2018 | 243 |
| 2019 | 239 |
| 2020 | 226 |
| 2021 | 223 |
| 2022 | 222 |
| 2023 | 215 |
| 2024 | 194 |
Reported grade span varies in the early years. [5]
| Count date | Students |
|---|---|
| October 2019 | 238 |
| October 2020 | 226 |
| October 2021 | 224 |
| October 2022 | 223 |
| October 2023 | 216 |
| October 2024 | 193 |
| October 2025 | 187 |
| September 2026 | 187 |
Compare the same count month where possible. [6]
SPS projected 186 students for fall 2025 and counted 187, down from 193 a year earlier. September 2026 counted 187. [7][2]
Seattle’s under-18 population grew from about 100,000 in 2022 to 110,000 in 2024. Private schools’ share of K–12 enrollment rose from 21.8% in 2019 to 25.8% in 2024. [23][24]
Uncertainty weakens public schools.
Continued closure uncertainty gives families who can afford private school another reason to leave. With them go students, funding and advocates. Instead of protecting a safety net, we erode the public support that sustains it. Public schools need families from every socioeconomic background invested in their success.
District enrollment exceeded a key closure-era forecast
| School year | Forecast | Actual | Above forecast |
|---|---|---|---|
| 2024–25 | 48,674 | 49,240 | 566 |
| 2025–26 | 47,913 | 48,957 | 1,044 |
SPS gained 14 students in 2024–25, then lost 283 in 2025–26. Both totals exceeded this forecast. The record supports questioning projections; it does not show uninterrupted growth or establish that withdrawing closures caused enrollment to rise. [31][32]
04Public investment
Invest here. Then walk away?
Keep these investments working for students and their neighborhoods.
$9M
Estimated upgrade spending
2015–18 projects [36]
- Cafeteria, seismic, HVAC and associated upgrades$8,951,594
$1.2M
Capital allocated this year
2026–27 adopted budget [38]
- Windows, doors and cladding$566,229
- Seismic improvements$683,237
Annual allocations cover one fiscal year; they are separate from total project costs.
BEX VI · 2026–31
Lighting and technology.
LED lighting and controls. Student and staff devices, digital learning and cybersecurity. [30]
- Windows, doors, masonry and seismic upgrades2026–28 project · BEX V [11]
Projects, amounts & sources
Earlier projects and levy plans
- Cafeteria, seismic, HVAC and associated upgrades$8,951,594
2015–18 projects · BTA III / BEX IV · Estimated spending [36]
- Cafeteria and seismic construction contract · included in total$4,895,547
2020 closeout · BTA III / BEX IV · Paid construction contract [36]
- HVAC construction contract · included in total$1,657,083
2017 closeout · BTA III / BEX IV · Paid construction contract [34]
- Playground$105,000
2018 levy estimate · BEX V · Original levy estimate [37]
- Exterior cladding$963,732
2018 levy estimate · BEX V · Original levy estimate [37]
- Exterior doors$102,944
2018 levy estimate · BEX V · Original levy estimate [37]
- Exterior windows$1,259,423
2018 levy estimate · BEX V · Original levy estimate [37]
- Field conversion$412,302
2018 levy estimate · BEX V · Original levy estimate [37]
Construction record
- Synthetic turf and flagpole
Completed 2021 · accepted 2023 · BEX V [39]
- Windows, doors, masonry and seismic upgrades
2026–28 project · BEX V [11]
Contracts shared with other schools
These amounts cover multiple schools and are excluded from this school’s totals.
- Playgrounds at 10 schools$1,710,063
Shared completed project · 2021 closeout [40]
05Learning
Student outcomes.
Academic excellence for every student builds families’ trust. Keep expectations high, give each learner the support to succeed and measure progress honestly. SPS should improve outcomes, not dilute the metrics used to judge them. That is how Seattle can become the nation’s No. 1 urban school district.
Students meeting the state standard in 2025–26, as a share of those tested. [12]
English language arts
Mathematics
All tested grades · General assessments · Tested-student denominator.
The 2025–26 science result is suppressed, not zero.
Different schools. A shared public purpose.
John Stanford envisioned an international school built around language and culture, preparing children for a global future. The school that carries his name chose Spanish and Japanese after surveying 5,000 parents and 1,200 business leaders. Its programs began in 2000 and 2001. Community input and a distinctive model were part of the design. [33]
That is the spirit we want SPS to build on: schools rooted in their communities’ strengths and needs, with room to try different approaches. Evaluate children’s learning and wellbeing, improve or retire approaches that fail, and share those that succeed—with equitable access across neighborhoods. A school monoculture needs evidence that it serves children better; easier administration is not enough. This is our proposed approach, not a quotation from Stanford.
Compare the last five school years
| School year | ELA | Math | Science |
|---|---|---|---|
| 2021-22 | 79.3% | 78.8% | Suppressed |
| 2022-23 | 75.7% | 76.7% | Suppressed |
| 2023-24 | 75.7% | 74.8% | Suppressed |
| 2024-25 | 77.5% | 78.6% | 84.0% |
| 2025-26 | 81.0% | 78.3% | Suppressed |
Suppressed results are not reconstructed. These are results for tested grades, not all enrolled K–5 children. Current dataset vintage: September 9, 2026.
Historical results and what is still missing
A visually verified 2004–05 WASL table reports 85.7% proficiency in grade-4 math, 90.5% in reading, 81.0% in writing, and 65.7% in grade-5 science. These are a different test regime and should not be joined to modern results as a continuous comparable trend. [13]
The collected modern records span 11 school years, including the delayed fall 2021 administration. The 2019–20 spring tests were cancelled. A complete 25-year assessment series remains unfinished; scores alone do not isolate a school’s contribution from its pupils’ other experiences.
06History
A Madison Park landmark.
The area’s history begins long before its subdivision, with Duwamish use of this Lake Washington shore. Later, the Madison Street route, waterfront recreation and cable-car service helped shape Madison Park. [14]
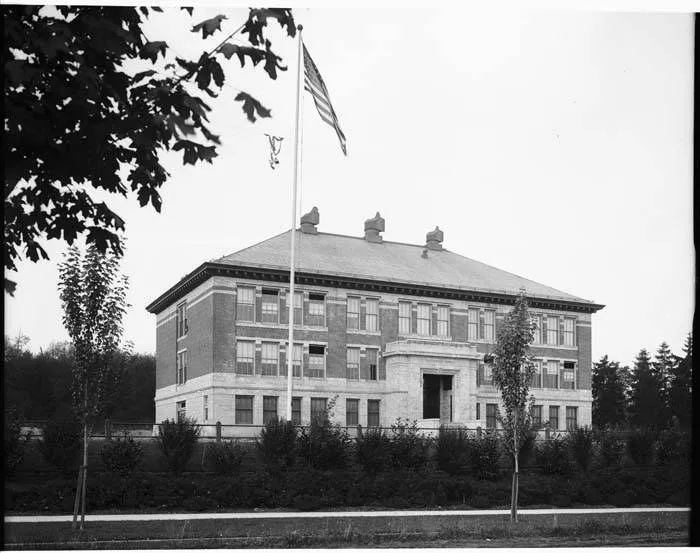
Lake School opened here in 1899 with about 50–60 pupils. Edgar Blair’s nine-classroom brick building followed in 1913, and the school took the McGilvra name in 1914. The Landmarks Preservation Board voted for designation in 2014. [1]
.jpg)

Before another closure proposal
The community deserves
answers, not assumptions.
01Which costs would actually disappear—and which would remain?
02What would change for students, including at the receiving school?
03What do the families, staff and neighbors directly affected want?
07Research
Sources & citations.
- 01
Seattle Public Schools
McGilvra school history, 2022 editionSchool origins, building, historic enrollment and parent-funded programs. Printed pp. 301–303.
- 02
Seattle Public Schools
September 2026 P223 enrollment report187 students. PDF p. 61. September count; not an October count.
- 03
Seattle Public Schools
2015–18 capital package: final acceptance report$9,071,594 funding; about $120,000 expected underspend. Includes cafeteria and other phases. PDF pp. 2, 5.
- 04
Capitol Hill Seattle
The September 2024 closure alternativesContemporaneous reporting on the initial alternatives. Distinct from the later four-school recommendation.
- 05
NCES / Urban Institute
Common Core of Data: McGilvra annual records39 annual observations, fall 1986–2024. Urban Institute is the distributor of the NCES series.
- 06
Seattle Public Schools
Monthly P223 enrollment archive68 reports, September 2019–September 2026. The on-page chart separates October counts from the latest September observation.
- 07
Seattle Public Schools
2025–26 annual enrollment reportTable 1-D, PDF p. 21: projected 186; actual 187; previous year 193.
- 08
Washington OSPI
School-level expenditure data and allocation methodActual expenditures include district allocations. The denominator is annual-average student FTE.
- 09
Seattle Public Schools
2025–26 school budgetPDF p. 102: $2,498,050 budget; 15.7 school-funded staff FTE. An allocation, not audited actual spending.
- 10
Seattle Public Schools
McGilvra levy and building historyElevator, roof, mechanical, playground and network projects. Some entries overlap; do not sum project listings.
- 11
Seattle Public Schools
Current capital projects, 2026–2028Announced work on McGilvra windows, doors, masonry and seismic safety. Total actual cost not established.
- 12
Washington OSPI
State assessment results, 2021–26All Students, All Grades, general assessments. Current tested-student denominator; September 9, 2026 vintage.
- 13
Seattle Public Schools / U.S. Supreme Court archive
2004–05 WASL resultsSPS report, PDF p. 145. Grade 4 reading, math, writing; grade 5 science. Historical test regime.
- 14
HistoryLink
Madison Park: thumbnail historyDuwamish history, neighborhood development, the Madison Street route and waterfront recreation.
- 16
Seattle School Board
November 26, 2024 withdrawal recordThe October recommendation named North Beach, Sacajawea, Sanislo and Stevens, not McGilvra.
- 17
Seattle Public Schools / NCES
School directory and campus locationsCurrent SPS school names and addresses; 2024–25 NCES campus coordinates via Urban Institute. Seven nearby K–5-serving campuses compared; routes use campus coordinates rather than individual homes.
- 18
Valhalla / FOSSGIS / OpenStreetMap
Driving and walking route estimates, October 7, 2026Cached public routing results. Driving ranked by shortest route distance; walking modeled at 4.8 km/h with crossing narration. No live traffic. Routes include stairs; estimates are not an accessibility assessment.
- 19
Seattle Department of Transportation
Seattle Streets: official arterial classificationsPrincipal, minor and collector arterial centerlines, retrieved October 7, 2026. Crossings are estimates from route geometry, not field inspections; repeated streets appear once.
- 20
Seattle Public Schools · GIS
Elementary attendance-area polygons, 2025–26Latest public geometry located October 7, 2026. McGilvra, Madrona, Montlake and Stevens; original school IDs retained. The geometry is not labeled 2026–27, so the map preserves its published vintage.
- 21
Seattle Public Schools · Enrollment Planning
Elementary attendance areas, 2026–27 district mapCurrent PDF reference, updated June 10, 2026. Distinct from the 2025–26 geometry used in the interactive map. Nearby schools are comparisons; no capacity or reassignment decision is implied.
- 22
King County GIS
Major waterbodies: geographic map contextLake Washington and Lake Union polygons, retrieved October 7, 2026. Combined with SDOT street centerlines to situate school communities; all map layers are served locally.
- 23
U.S. Census Bureau · American Community Survey
Seattle population under 18: ACS table B09001One-year estimates, 2010–2024; Seattle city, Washington (state 53, place 63000). Fourteen observations, with no standard 2020 release. Includes infants and preschool-age children. 2024: 109,519 ± 6,349 at 90% confidence.
- 24
U.S. Census Bureau · American Community Survey
Seattle public and private enrollment: ACS table B14002One-year estimates of city residents, both sexes, kindergarten through grade 12. Private share = private / (public + private), excluding preschool and college. It is not the share attending schools physically located in the city or a measure of departures from SPS.
- 25
U.S. Census Bureau
Why 2020 has no standard ACS one-year estimatePandemic disruptions prevented the standard release. Experimental 2020 estimates are not mixed into the trend. Dashed chart segments and hollow dots identify linear interpolation between 2019 and 2021; those values are not Census observations.
- 26
U.S. Census Bureau
ACS estimates and margins of errorCity population uses the published 90% margin. Private-share uncertainty uses the Census approximation for a proportion derived from summed cells, including the ratio fallback when needed. Survey margins appear in the data table and chart point descriptions.
- 27
U.S. Census Bureau
2025 ACS release timing: August 2026 updateThe Bureau reported that the 2025 ACS one-year release date was still being determined. The city series uses data through 2024, the latest official files retrieved October 7, 2026, without inventing later values.
- 28
Washington OSPI
F-196 actuals: expenditures by school location2023–24 and 2024–25 Actuals Child General Fund Expenditures files. Sum Amount for district 17001, school 2201. School-coded actuals can include allocations made by SPS before submission; they are not a pure direct-cost ledger.
- 29
Washington OSPI
School-level expenditure reporting and shared costs2019–20 accounting changes, slides 38–46: school location coding, district pre-allocation and OSPI allocation of non-instructional costs. Used to explain reporting scope, not to assert an unchanged current allocation formula.
- 30
Seattle Public Schools
BEX VI capital levy: approved 2025, collected 2026–2031$1.8 billion districtwide. McGilvra is listed for interior LED lighting, lighting controls and district technology investment; the school list does not assign a McGilvra-specific dollar amount.
- 31
FLO Analytics / Seattle Public Schools
April 2024 ten-year enrollment forecastPage 29, Table A-2: middle scenario 48,674 for 2024–25 and 47,913 for 2025–26. This is a dated long-range scenario, not the district’s latest annual staffing projection. Preschool and full-time Running Start are excluded.
- 32
Seattle Public Schools
District annual enrollment: 2021–22 through 2025–26Annual headcounts: 49,226 in 2023–24, 49,240 in 2024–25 and 48,957 in 2025–26. Compare like annual series, rather than mixing monthly headcount or budget FTE.
- 33
John Stanford International School / SPS
John Stanford’s vision and community inputStanford’s international-school vision; Spanish and Japanese programs began in 2000 and 2001. Language choices followed a survey of 5,000 parents and 1,200 business leaders. Our proposed cycle of testing and improving models is advocacy, not a Stanford quotation.
- 34
Seattle Public Schools
McGilvra HVAC: 2017 final acceptanceP5062 final contract: $1,657,083 including sales tax. All payments made, no outstanding invoices. Phase two of the three-phase capital package; included in its total. PDF p. 2.
- 35
Seattle Public Schools
2025–26 recommended capital budget: McGilvra exteriorPDF p. 185: $2,264,915 annual appropriation for windows, doors and cladding. Budgeted funding, not verified spending or the full project cost. Separate from the 2015–18 package.
- 36
Seattle Public Schools
McGilvra 2015–18 package: final acceptance2020 closeout: $9,071,594 funding less about $120,000 expected unspent; estimated spending, not an audited ledger.
- 37
Seattle Public Schools
BEX V levy resolution and original project estimatesOct. 30, 2018 board action packet. Budget attachment is labeled preliminary; estimates precede escalation and later project changes. PDF pp. 18–19.
- 38
Seattle Public Schools
2026–27 adopted capital budgetAnnual project allocations, not lifetime costs or remaining balances. PDF pp. 185–187; printed pp. 178–180.
- 39
Seattle Public Schools
Jan. 18, 2023 board meetingFinal acceptance of Lafayette upgrades, Graham Hill playground and McGilvra field.
- 40
Seattle Public Schools
2020 playground improvements at 10 schools: final acceptance2021 closeout: shared completed project $1,710,063. No school-level split. Amount appears on PDF p. 3.
- 41
McGilvra Elementary School PTA
Enroll at McGilvra ElementarySchool introduction, enrichment, family involvement and tours. Accessed Oct. 9, 2026.
- 42
Seattle Public Schools
New Directors Sworn in to Seattle School BoardDec. 8, 2025. Kathleen Smith and Jen LaVallee joined; Joe Mizrahi and Vivian Song continued after the November election.
- 43
Seattle Public Schools Archives
SPS directors and superintendents2025 revision, page 9. Brent Jones resigned in 2025; Fred Podesta served as interim superintendent.
- 44
Seattle Public Schools
New Superintendent Begins Tenure Leading Seattle Public SchoolsFeb. 2, 2026. Ben Shuldiner began leading the district.
- 45
McGilvra Elementary School PTA
Standing Up for McGilvraPublished enrollment outreach priorities include school tours and parents sharing their experiences with prospective families. Accessed Oct. 9, 2026.